As we approach the seasonal slowdown that typically occurs during the winter months, it may be time to look for some creative ways to attract potential buyers. Here are few tips for getting the listing sold!
- Change things up: Don’t let your listings getting stale. Try changing the main photo on the listing to attract new eyes or update the property description to include more details about the local schools or neighborhood. According the 2014 NAR Profile of Home Buyers and Sellers the typical home search process took 10 weeks for a buyer to find a home, and generally the first two weeks are spent researching before even contacting an agent. Buyers are likely to see many of the same listings more than once as they search across different websites, so a small change might help to capture their attention.
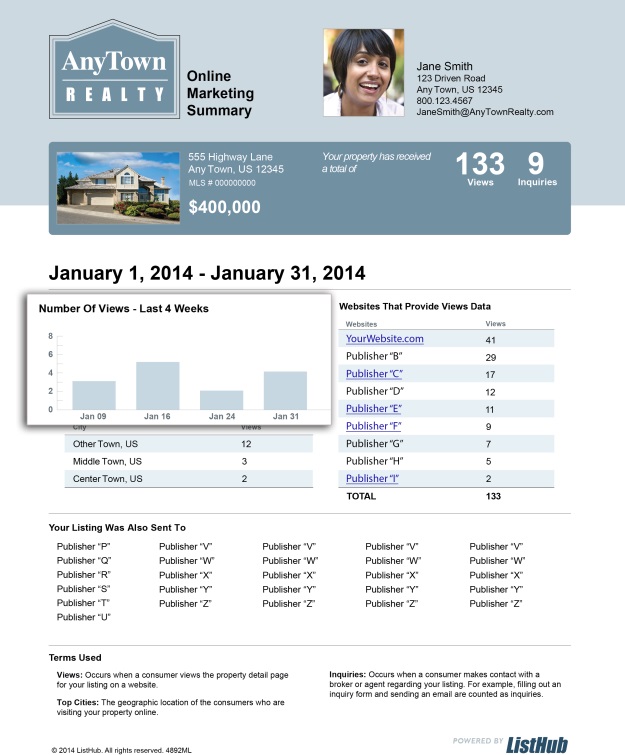
Not sure if it makes a difference? Test it out! ListHub collects metrics to indicate how many times a listing is viewed across the entire network of ListHub publishers and measure trends over time. See how changing the photo impacts the number of views your listing is receiving with ListHub’s Seller Reports. - Consider adding incentives: 45% of homes that are on the market for 17 weeks or more offer buyer incentives. The most frequently offered incentive is a home warranty policy or assistance with closing costs. Other ideas might include offering some home furnishings or appliances that weren’t originally included in the sale.
- Reconsider your pricing strategy: As the cold weather approaches and leads may begin to slow it may be time to share data that will help reframe your client’s price expectations. For example, ListHub’s Reports can provide valuable insights about what property types, in your listing inventory, are performing well online. For example, if your client’s home is listed just over $300,000, you could share how many more online traffic the property might receive it was priced under $300,000 based on your historical ListHub metrics.
Another valuable tool is ListHub’s Seller Report bar graph (pictured below) which shows four weeks of online traffic for an individual listing. Is the bar graph trending down, as online traffic decreases? If so, let the data speak for itself.

For more information on ListHub reports for brokers or agents contact the team at info@listhub.com.
Check out the video below to learn how to use the ListHub Reports to price your listings to sell:
Published: November 2014