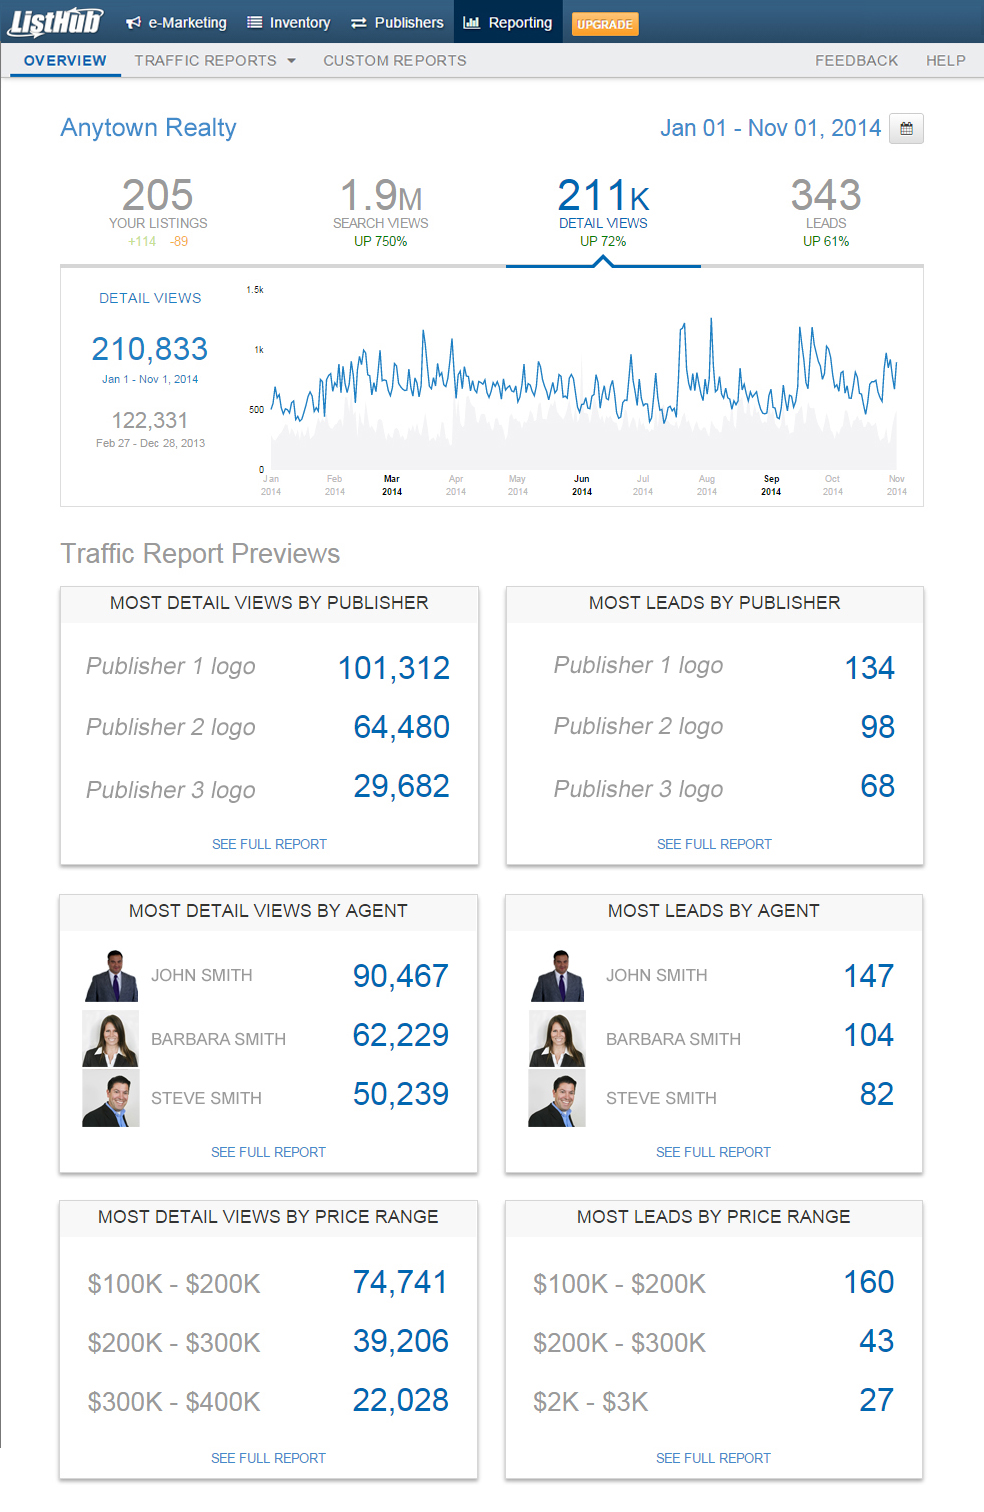
In case you missed our announcement in November, we are excited to reveal the completion of our brand new broker and agent reporting dashboard! The new dashboard is coming soon to MLS markets across the country.
There are many new exciting features, including a fresh dynamic interface that will provide your members with the ability to access even more data – with greater flexibility to help them gain meaningful insights about their online marketing.

Some of the other reporting features of the new dashboard include:
- An interactive format to allow brokers and agents to sort, search, and filter data in a variety of ways
- Reporting metrics include summary views, allowing you to see the total number of times listings appeared in a publisher’s search results
- Lead ratio data to see how well publishers are converting views to leads
- Ability to sort data ranges with the click of a button to find information fast
- Visual graphs for key metrics such as summary views, detail views, and leads
- Ability to view data trends over time periods like month-over-month or week-over-week, plus metrics for specific offices or date ranges
- Ability to easily track the total listing inventory and changes to the listing inventory over time
- Custom reports to choose a number of different criteria dimensions in order to sort metrics
Click play on the video below to watch a video overview of the new reporting dashboard and the new features your brokers and agents will soon be able to access.
If you have questions or would like to schedule one-on-one training for your MLS staff on the new reporting dashboard and other ListHub features, please contact our training team at trainingteam@listhub.com.